
Resilient markets, rising yields and the widening opportunity set
Key takeaways
- Equities have remained resilient despite higher bond yields, with the strongest markets including those where yields rose the most – Korea, Japan and the US.
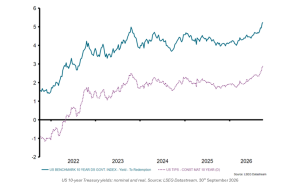
- The rise in US yields has been led mainly by real yields, suggesting inflation hasn’t been a key driver. The market is focused on stronger growth expectations and/or higher risk compensation.
- Global earnings forecasts have improved, especially in emerging markets, while earnings growth has outpaced market gains and made valuations more attractive.
- AI is increasingly both an equity and a credit story. The central issue is whether future cash flows can justify unprecedented capital spending, borrowing and off-balance-sheet commitments.
- High index concentration does not imply a narrow opportunity set. Energy, infrastructure, reshoring, defence, healthcare, critical materials and emerging-market reform may shape the next decade.
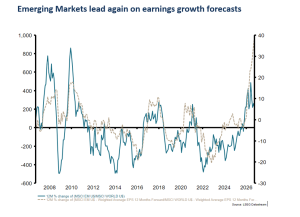
Emerging Markets lead again on earnings growth forecasts
A supportive fundamental backdrop
Equity markets have remained resilient as 10-year government bond yields have risen across most major markets. Notably, some of the strongest equity performance has occurred where yields increased most, including Korea, Japan and the US. This is consistent with the view that higher yields are, at least partly, reflecting improved growth expectations rather than a simple deterioration in financial conditions.
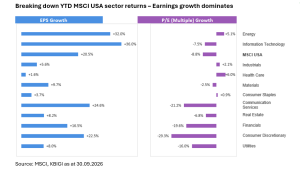
The earnings backdrop has also strengthened. Global forecasts have been revised upwards during 2026, with the largest upgrades in emerging markets. Because earnings growth has outpaced equity market appreciation, absolute valuations have become more attractive relative to their own history.
Breaking down YTD MSCI USA sector returns – Earnings growth dominates
What are bond markets signalling?
US 10 Year yields – Nominal and Real – inflation is not yet priced in
The bullish interpretation: stronger growth
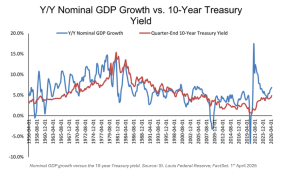
Bond markets may be responding to stronger real activity: AI investment is driving a genuine capital-expenditure boom, productivity expectations are improving, corporate demand for capital is increasing, and nominal GDP growth remains robust. If nominal US GDP growth stays around 5–6%, a 5% 10-year Treasury yield need not be restrictive; historically, government yields have often remained close to or below nominal growth during sustained expansions.
• Earnings upgrades can offset part of the pressure from higher discount rates.
• Cyclicals, banks and industrial beneficiaries of investment spending may perform well.
• Market concentration could persist while perceived AI leaders continue to attract capital.
The bearish interpretation: a higher risk premium
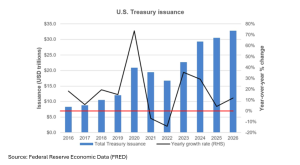
Alternatively, yields may increasingly reflect concerns about fiscal sustainability, credit quality and growing Treasury supply. Total issuance of treasury notes and bonds has increased from $8.3trillion in 2016 to $32.8 trillion in the year to end August 2026. That’s an average of 14.7% increase in each of the last 10 years.* A rising term premium is more difficult for equities because it lifts discount rates without a matching improvement in earnings expectations. The tension is clear: yields behave as though nominal growth remains strong, while equity valuations imply capital remains abundant and relatively inexpensive. That combination may not be sustainable indefinitely. * https://fiscaldata.treasury.gov/datasets/monthly-statement-public-debt/summary-of-treasury-securities-outstanding
The late-1990s experience is relevant. When government bonds offered yields near 6%, they became a credible alternative to higher-risk growth assets. Today, future cash flows from long-duration growth companies must again be judged against a meaningful risk-free return.
AI is no longer just an equity theme – it’s a new debt cycle
The AI investment cycle is no longer solely an equity story. Hyperscalers have evolved from largely self-financing businesses into major borrowers as they fund multi-year data-centre programmes. According to the BIS**, hyperscaler bond issuance exceeded $100 billion in 2025.**https://www.bis.org/publications/qr-202603/financing-ai-infrastructure-boom-on-and-off-balance-sheet-borrowing Capital is being directed towards data centres, power and transmission infrastructure, networking equipment and GPUs.
In the near term, this borrowing can stimulate activity by supporting construction, employment and equipment demand. However, it also transfers part of the AI thesis into credit markets.
Hyperscaler debt issuance and the share of supply across regions
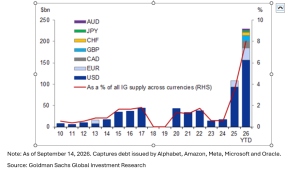
The same research paper from Goldman Sachs indicates that Lower-rated credit spreads have widened, indicating uncertainty about whether future returns will justify the investment. It also forecasts the market expects $420 billion of new global Investment Grade debt issuance from hyperscalers in 2027. ***
*** https://finvaulta.com/research/goldman-sachs/an-update-on-ai-related-debt-issuance-2026-09-17
Off-balance-sheet commitments add complexity
A growing share of financing is being arranged through joint ventures and special-purpose vehicles that own data-centre assets. Private credit often funds these structures, supported by long-term purchase commitments from hyperscalers. Economically, the commitments can resemble debt even when the associated obligations do not sit directly on corporate balance sheets. The structures are not inherently unsound, but their rapid expansion is a cause for worry, particularly because off-balance-sheet financing often grows during periods of elevated optimism and weaker audit scrutiny.
The cash-flow assumption beneath the AI trade
Current hyperscaler valuations and financing plans rest on a powerful assumption: operating cash flows are expected to rise from roughly $600 billion in 2025 to about $2 trillion by 2030. If this does not materialise, enthusiasm could fade, credit spreads widen, and capital-expenditure plans could be delayed or cancelled, with knock-on consequences for US growth.
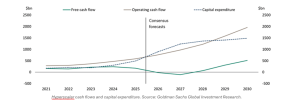
This cycle differs from the telecom bubble because investment is concentrated among a small number of large, profitable companies with established competitive advantages. That improves the credibility of the spending but does not remove risk. Concentration is itself a vulnerability: every bond, private-credit vehicle, data-centre loan and SPV relies, directly or indirectly, on a similar cash-flow outcome.
High concentration can obscure a broad opportunity set
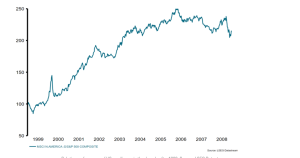
The central lesson from 1999 is not simply that technology became overvalued. While markets focused on internet and TMT stocks, the foundations of the following decade were forming elsewhere: Asia was recovering from the 1997–98 financial crisis, Europe was preparing for a common currency, China was becoming a global manufacturing power, emerging markets were rebuilding, and oil was beginning the rally that preceded the commodity supercycle.
The strongest opportunities of the 2000s therefore extended well beyond avoiding the NASDAQ decline. They included emerging markets, commodities, energy, infrastructure, industrial development and companies benefiting from China’s growth. A concentrated index did not mean a concentrated global economy.
Beneath today’s dominant narrative
AI may transform productivity and leading technology companies may continue to generate substantial shareholder value. Yet an exclusive focus on AI risks overlooking other structural changes already under way:
- Power generation, grid investment and broader physical infrastructure renewal, driven by electrification, data centres and long-standing underinvestment.
- Industrial automation and reshoring as supply chains are reconfigured and governments pursue more active industrial policies.
- Defence, semiconductor, healthcare-security and critical-mineral spending, increasingly viewed through a geopolitical as well as an economic lens.
- Healthcare innovation and rising demand associated with ageing populations.
- Emerging-market reforms and shifts in regional economic leadership.
These are structural forces, not short-term narratives. As in 1999, some of the defining opportunities for the future may already be visible in areas receiving far less attention than the market’s dominant theme.
1999 spawned a tough decade for IT, but small caps thrived over the same period
Investment implications
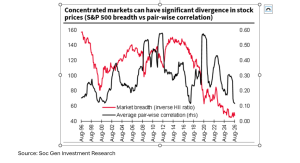
The comparison with the late 1990s does not solely imply that today’s technology leaders must underperform or should be avoided. It also highlights a different risk: when a small number of companies dominate index returns, investors can mistake market concentration for economic uniformity.
The opportunity set may, in fact, be widening. Investors should distinguish between areas attracting the most attention and those capable of generating durable long-term value. In 1999, the significance of China, commodities, energy and Asia’s recovery was underestimated. Today, the corresponding challenge is to assess which developments beyond AI are still underappreciated, while remaining disciplined about whether AI-related cash flows can support the capital now being committed.
Sources referenced in the original letter: Bank for International Settlements; LSEG Datastream; St. Louis Federal Reserve; FactSet; Goldman Sachs Global Investment Research.
Disclaimers
All Markets
KBI Global Investors Ltd is regulated by the Central Bank of Ireland. KBI Global Investors (North America) Ltd is a registered investment adviser with the SEC and regulated by the Central Bank of Ireland. KBI Global Investors (North America) Ltd is a wholly-owned subsidiary of KBI Global Investors Ltd. ‘KBI Global Investors’ or ‘KBIGI’ refer to KBI Global Investors Ltd and KBI Global Investors (North America) Ltd.
IMPORTANT RISK DISCLOSURE STATEMENT
Under MiFID II this is deemed marketing material and should not be regarded as investment research. This material is provided for informational purposes only and does not constitute an offer to sell or the solicitation of an offer to purchase any security, product or service including any group trust or fund managed by KBI Global Investors. The information contained herein does not set forth all of the risks associated with this strategy, and is qualified in its entirety by, and subject to, the information contained in other applicable disclosure documents relating to such a strategy. KBI Global Investors’ investment products, like all investments, involve the risk of loss and may not be suitable for all investors, especially those who are unable to sustain a loss of their investment.
PAST PERFORMANCE IS NOT NECESSARILY INDICATIVE OF FUTURE RESULTS
This introductory material may not be reproduced or distributed, in whole or in part, without the express prior written consent of KBI Global Investors. The information contained in this introductory material has not been filed with, reviewed by or approved by any regulatory authority or self-regulatory authority and recipients are advised to consult with their own independent advisors, including tax advisors, regarding the products and services described therein. The views expressed are those of KBI Global Investors and should not be construed as investment advice. We do not represent that this information is accurate or complete and it should not be relied upon as such. Opinions expressed herein are subject to change without notice. The products mentioned in this Document may not be eligible for sale in some states or countries, nor suitable for all types of investors. Past performance may not be a reliable guide to future performance and the value of investments may fall as well as rise. Investments denominated in foreign currencies are subject to changes in exchange rates that may have an adverse effect on the value, price or income of the product. Income generated from an investment may fluctuate in accordance with market conditions and taxation arrangements. In some tables and charts, due to rounding, the sum of the individual components may not appear to be equal to the stated total(s). Additional information will be provided upon request. Performance for periods of more than 1 year is annualized. Gross results shown do not show the deduction of investment management fees. A client’s actual return will be reduced by the management fees and any other expenses which may be incurred in the management of an investment account. For example, a €1,000,000 investment with an assumed annual return of 5% with a management fee of 0.85% would accumulate €8,925 in fees during the first year, €48,444 in fees over five years and €107,690 in fees over ten years.
Estimates are not guaranteed and should not be relied upon to make investment decisions.
GIPS Performance Disclaimer
Our firm claims GIPS compliance and is annually verified by an independent verification firm to be so. The verification report from our verifier and our GIPS composite presentation are available upon request. The performance record disclosed here is that of the firm’s composite for this strategy.
USA/CANADA SPECIFIC: Indices
Information about indices is provided to allow for comparison of the performance of the Adviser to that of certain well-known and widely recognized indices. There is no representation that such index is an appropriate benchmark for such comparison. You cannot invest directly in an index, which also does not take into account trading commissions and costs. The volatility of the indices may be materially different from that of the strategy. In addition, the strategy’s holdings may differ substantially from the securities that comprise the indices shown. All MSCI data is provided “as is”. In no event shall MSCI, its affiliates, or any MSCI data provider have any liability of any kind in connection with the MSCI data. No further distribution or dissemination of the MSCI data is permitted without MSCI’s prior express written consent. Net total return indices reinvest dividends after the deduction of withholding taxes, using (for international indices) a tax rate applicable to non-resident institutional investors who do not benefit from double taxation treaties
MSCI World: The MSCI World index covers more than 1,600 securities across large and mid-cap size segments and across style and sector segments in 23 developed markets. MSCI World Value: The MSCI World Value Index covers more than 800 securities across large and mid-cap stocks exhibiting overall value style characteristics in 23 developed markets. The Russell 2000 is a small-cap stock market index of the bottom 2,000 stocks in the Russell 3000 index. The S&P 500 Index is a market-cap weighted index including 500 of the leading large-cap US equities. MSCI EM: The MSCI Emerging Markets Index covers more than 800 securities across large and mid-cap segments and across style and sector segments in 23 emerging markets. MSCI World Small Cap: The MSCI World Small Cap Index covers more than 4,000 securities across small-cap stocks and across style and sector segments in 23 developed markets.
This information contains forecasts, which are estimates only and not a reliable indicator of future performance.
Gross results shown do not show the deduction of Adviser’s fees. A client’s actual return will be reduced by the advisory fees and any other expenses which may be incurred in the management of an investment advisory account. See Part 2 of Adviser’s Form ADV for a complete description of the investment advisory fees customarily charged by Adviser. For example, a $1,000,000 investment with an assumed annual return of 5% with an advisory fee of 0.85% would accumulate $8,925 in fees during the first year, $48,444 in fees over five years and $107,690 in fees over ten years. Performance returns for individual investors may differ due to the timing of investments, subsequent subscriptions/redemptions, share classes, fees and expenses. Stocks mentioned in this document may or may not be held in this strategy at this time. Any projections, market outlooks or estimates in this document are forward-looking statements and are based upon certain assumptions. Other events which were not taken into account may occur and may significantly affect the returns or performance of the strategy. Any projections, outlooks or assumptions should not be construed to be indicative of the actual events which will occur. Discussions of market conditions, market high/lows, objectives, strategies, styles, positions, and similar information set forth herein is specifically subject to change if market conditions change, or if KBIGI believes, in its discretion, that investors returns can better be achieved by such changes and/or modification. Style descriptions, market movements over time and similar items are meant to be illustrative and may not represent all market information over the period discussed. Form ADV Part 1 and Part 2 are available on request.
Stocks mentioned in this document may or may not be held in this strategy at this time. The securities listed are selected based on objective, consistently applied, non-performance-based criteria. Size or profitability of stocks mentioned have not been used in determining the selection of stocks and their inclusion should not be construed as a stock recommendation. A complete list of all securities recommended for the immediately preceding year is available upon request.
Any projections, market outlooks or estimates in this document are forward-looking statements and are based upon certain assumptions. Other events which were not taken into account may occur and may significantly affect the returns or performance of the strategy. Any projections, outlooks or assumptions should not be construed to be indicative of the actual events which will occur. Discussions of market conditions, market high/lows, objectives, strategies, styles, positions, and similar information set forth herein is specifically subject to change if market conditions change, or if KBIGI believes, in its discretion, that investors returns can better be achieved by such changes and/or modification. Style descriptions, market movements over time and similar items are meant to be illustrative, and may not represent all market information over the period discussed. Form ADV Part 1 and Part 2 are available on request.
Australia Specific:
KBI Global Investors (North America) Ltd is exempt from the requirement to hold an Australian Financial Services licence in respect of the financial services it provides to wholesale investors in Australia and is regulated by both the Central Bank of Ireland and the Securities and Exchange Commission of the US under US laws which differ from Australian laws. Any services provided in Australia by KBI Global Investors Ltd or other affiliates will be provided by the relevant entity as representative of KBI Global Investors (North America) Ltd. Ambassador Funds Management Services Pty Ltd (ASFL: 33 17 17) is licensed to provide general product advise in Australia and New Zealand to wholesale clients.
This material and any offer of investments is intended for and can only be provided and made to persons who are regarded as wholesale clients for the purposes of the Corporations Act of Australia and must not be made available or passed on to persons who are regarded as retail investors. It may not be reproduced or distributed, in whole or in part, without the express prior written consent of KBI Global Investors (North America) Ltd. The information contained in this introductory material has not been filed with, reviewed by or approved by any Australian or United States regulatory authority or self-regulatory authority and recipients are advised to consult with their own independent advisors, including tax advisors, regarding the products and services described therein.
Issued by Ambassador Funds Management Services Pty Ltd ABN 91 133 740 057.
Contact Information: Ambassador Funds Management Services, Level 12, 3 Spring St, Sydney NSW 2000, Australia. Ph: 61 2 9081 0230. Fax: 61 2 9081 0231, Level 16, 461 Bourke St, Melbourne VIC 3000, Australia, Ph: 61 3 8652 2848. Fax 61 3 8652 2849 www.ambassadorfms.com
Switzerland
KBI Institutional Fund ICAV is a collective investment scheme established under Irish Law. The Prospectus, the Key Investor Information Document (KIID), the Memorandum and Articles of Association together with the annual and semi-annual reports of KBI Institutional Fund ICAV can be obtained free of charge from the Swiss representative ACOLN Fund Services AG, Affolternstasse 56, CH-8050 Zurich. Paying agent in Switzerland is NPB New Private Bank Ltd, Limmatquai1, AMBellevue, Postfach, CH-8024 Zurich. The views expressed in this document are expressions of opinion only and should not be construed as investment advice.
If you no longer wish to receive emails from us in the future, please click Here to unsubscribe.