Time to realign: KBI Global Investors Q2 2025 Commentary.
- The US has an overvaluation problem, but it’s concentrated in tech
- Europe and Global ex US, offering better growth prospects, sees inflows rise
- Proactive realignment can mitigate concentration risk
Market overview: Q2 gives more reasons to look beyond US tech
Market overview: Q2 gives more reasons to look beyond US tech
We’ve long argued that a market rotation is the most likely outcome for equity markets over the medium to long term. Why? Because the over-concentration in US megacaps has led to extreme valuation anomalies and significant momentum distortions.
Other parts of the global equity market – whether regions, styles, sectors or market cap – that have been out of favour in recent years are likely to offer better performance in the future. Investors with concentrated US tech portfolios will be better served by more diversified global approaches.
US tech stocks have been the location of choice for global capital for almost a decade, siphoning foreign money away from worthy home-country opportunities. These opportunities are now getting more investor attention, in light of recent trade disruptions and the US’s fall in reliability as a team player in the global economy.
The drop in confidence in a global hegemonic market among investors, regardless of domicile, has helped non-US markets this year. A significantly improved earnings growth profile relative to US megacaps has also been a notable shift. Forecast EPS growth is now stronger in EAFE and EM for the first time since 2017.
There’s always noise in the short-term data, and markets can be very volatile from quarter to quarter – yet we see evidence unfolding of a continued trend towards broader diversification of equity portfolios and a renewed interest in investment opportunities beyond US tech.
The M7 names had a strong Q2, but so did many other types of stocks. Competition for market leadership is rising. This is particularly evident in flows of capital over the period. While the stock of global capital may not have been redirected in any meaningful way, the ongoing flows demonstrated a dramatic and significant shift in direction.
The US dollar continued to fall, declining by 12% since the start of the year. This marks its worst performance since 1973 – the year the Bretton Woods system was abandoned and the modern market for currency exchange emerged. The decline is despite higher levels of interest rates in the US, which makes it a very unusual selloff.
While many elements of a rotation were clear to see, styles have been massively volatile so far this year. Growth, having underperformed in the first quarter, outperformed in the second. We believe this is due primarily to the massive self-purchasing of shares by a handful of companies in markets with low turnover, resulting from a higher-than-normal level of uncertainty.
We devote much of this letter to looking at investor flows, which are clearly exploring opportunities outside of US megacap tech.
We also look at the turn in earnings growth profiles. Having led the rest of the world for EPS growth over the last decade, the US has now fallen behind.
Finally, we briefly revisit valuation differences. While the main US indices again achieved all-time highs, this was driven solely by multiple expansion.
To us, the strong rebound in US stock valuations reflects a worrying level of complacency, given the prevailing uncertainties. Despite the absence of any convincing resolutions on key global trade issues, investor sentiment has changed from extreme nervousness about the unpredictable policy approach to a blasé confidence that issues will be resolved positively. Historically high tariffs still apply for most countries trading with the US. The last time 10% tariffs were imposed on trading partners was in 1971.
For global capital, the US loses appeal.
After a long period of intense concentration in a few US megacaps, investors are beginning to explore opportunities outside the US market. Global ex-US funds, which have been out of favour for many years, attracted over USD2.5 billion in new money flows.
The FT reports that European and Asian investors put USD 2.5 billion into world ex-US mutual and exchange-traded funds between the start of December and the end of April, according to Morningstar data. These inflows mark a dramatic reversal after three years of net withdrawals.
Investors cite two reasons for this. Firstly, there’s an ongoing question mark over the reliability of the US’s role in the global economy. Some of the flows into ex-US funds have been described as “patriotic rebalancing”.
There’s a growing sense of discomfort among some investors, particularly in Europe, regarding investment in the US. Investors have grown fearful that sweeping tariffs could cause more harm to the US itself than to other major markets. On the other hand, Europe presents a new catalyst: an infrastructure and defence-led spending push that offers fiscal support and improved growth prospects.
A. Demand jumps for funds stripping out US stocks.
Source: Morningstar
The second reason for inflows into ex-US funds is the clear need for investors to rebalance their portfolios and diversify the overweight allocation to US megacap tech names. Positioning in these names is extremely crowded, with institutional portfolios, retail investors, and passive funds all heavily concentrated in this narrow segment of the market.
Amundi report that a large share of the money flowing into European funds since the Covid pandemic has gone into just two indices – the S&P 500 and the MSCI World, of which the US accounts for more than 70%. This concentration poses a risk of de-rating if sentiment shifts even modestly, as there is little remaining marginal buyer interest.
B. Holdings of global ex-US funds bounce back
Total assets ($bn)
Source: Morningstar
Similarly, data from LSEG’s Lipper Funds shows that more than USD 100 billion has flowed into European equity funds so far this year – up threefold from the same period last year – while outflows from the US have more than doubled to nearly USD 87 billion.
C. Europe’s equity boost
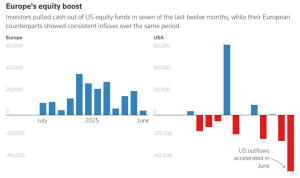
Source: LSEG
While the stock of global capital may not have been redirected in any meaningful way, the ongoing flows of retail money have shown a dramatic and consequential change in direction by investors outside the US.
The idea of US exceptionalism has been damaged; its natural appeal to global capital has eroded. For portfolios, this means a greater diversification in the allocation of new flows away from the dollar and US assets. The full extent to which foreign investors and institutions may yet divest from the existing stock of US assets remains to be seen.
D. Flows into foreign-domiciled US equity ETFs
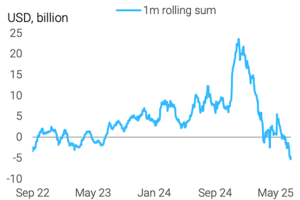
Source: Bloomberg
The US market still manages to rise.
Foreign money flowed out, but domestic retail and buybacks hit all-time highs.
The conundrum for the quarter, then, is how to explain the US market’s 11% rise if foreign investors pulled out so much money. The answer seems to lie with fearless domestic US retail investors and a record-breaking level of buybacks, as US corporates bought back massive amounts of their own stock.
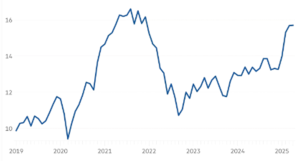
American retail investors are all in, buying at an unusually aggressive pace this year. Roughly half of US household wealth is now invested in stocks, breaking the record set during the dot-com bubble of 2000.
E. Aggregate allocation of US household wealth
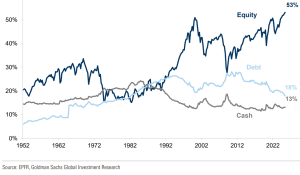
Source: EPFR, Goldman Sachs Global Investment Research
While institutional investors withdrew funds from the US market in Q2, retail investors purchased index funds. This is consistent with their mantra: ‘Buy the dips.’
F. Monthly flows in 2025 in S&P 500 ETFs – institutional oriented vs retail oriented
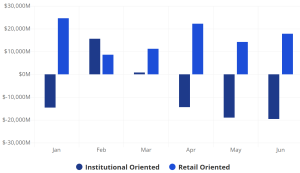
Source: CFRA’s ETF database as at June 20 2025
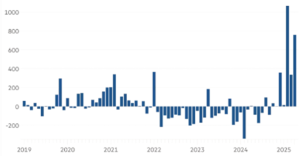
US corporations are investing a substantial amount of money in supporting their own share prices. Based on Bloomberg data, 2024 set a record for buybacks in the US, with just under a trillion dollars of shares repurchased. It appears that this level will be exceeded well before the end of this calendar year.
It’s challenging to gather buyback data accurately in real-time. Companies can announce buyback programmes but then execute them over varying periods, and there can be different conventions for calculation. However, to obtain a guide, we can track companies’ announcements and compare them year by year. It’s worth noting that, according to our own research, historically, only about two-thirds of the announced buybacks have been implemented, so the historical figures may be overstated.
The chart below, from a joint Bloomberg and Deutsche Bank survey, shows the frequency of weekly buyback announcements since 1995.
Annual US stock buybacks are set to exceed $1trn for the first time
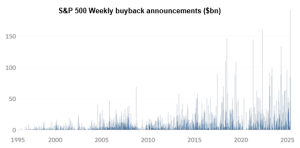
Sources: Deutsche Bank Asset Allocation, Bloomberg
The US market has just recorded the highest level of buyback announcements for a single quarter since 1995, when data on reported buybacks began to be collected. Corporate whispers suggest there’s more in the pipeline as they move to defend their valuations against a more difficult outlook. The size and speed of the buyback surge are driven by:
- cheaper prices after a Q1 selloff
- strong cash piles on the balance sheets
- Trade war worries are making planning more difficult.
S&P 500 data below, from a different source, paints a similar picture. It compares the level of buybacks in the first few months of this year with those in the same period of previous years. We can observe the gradual increase in repurchases over time, as well as the highs achieved so far this year.
H. Repurchasing announcements in the first four months of each year (to end April)
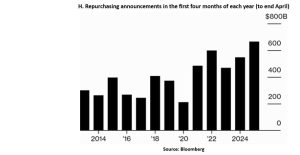
The amount of money likely to be deployed in 2025 as a whole is immense. Apple announced its intention to buy back USD 100 billion; Alphabet and Google announced plans to buy back USD 70 billion. These three stocks alone account for 20-25% of the estimated total for US share repurchases this year. (It’s not only in the market cap that we see high levels of concentration.)
Meanwhile, some industries – such as energy, utilities and materials – have chosen not to participate, and will return excess capital to shareholders exclusively in the form of dividends.
As of June 5, our data shows S&P 500 firms had announced approximately USD 750 billion in buyback authorisations – a pace notably ahead of past years’ levels at the same point. Since then, following the completion of the Fed’s stress tests at quarter’s end, some major banks have been quick to unveil additional buybacks: JPMorgan, USD 50 billion, and Morgan Stanley, USD 20 billion.
Stock buybacks became legal in the US in 1982 and have remained a feature of the technology sector. They’ve grown in popularity across the market since the corporate tax cuts of the first Trump administration in 2017. According to the Bloomberg study above, the reduction of corporate tax from 35% to 21% created corporate savings that have been used almost entirely to finance buyback programmes. These support share prices while also improving EPS by reducing the number of shares issued.
A notable change in earnings profiles
The key driver of US outperformance over the last decade has been a stronger earnings growth profile than other markets. While momentum and valuation have driven prices far, the underlying driver has always been US companies’ better earnings compared to their international competitors. That changed over the quarter and could mark a sea change in market dynamics.
There were markdowns in US earnings estimates as analysts priced in modest tariffs and inflation. According to FactSet, these reductions were larger than the average reduction over the last 15 years. And while they improved a little towards the end of the period, they’re now far behind the estimates for EAFE and EM earnings.
I: S&P 500: Sector-level change in Q225EPS
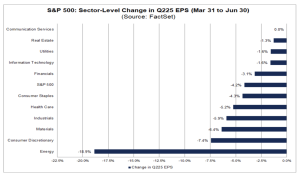
Source: FactSet
EAFE and EM earnings were marked up at a significant pace, much more so than US estimates. This is the first time since 2017 that the US has had a weaker EPS growth profile.
J. EAFE and EM 12-month forward EPS are now stronger than the US
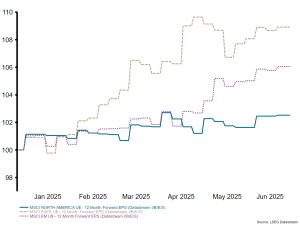
Source: LSEG Datastream
While the market rebound had very poor breadth and was mainly focused on the M7 names, it lifted the S&P index as a whole. Only 44 stocks out of the S&P 500 drove the index to new all-time highs. Overlaying prices with EPS changes for the year to date, we don’t get an encouraging picture.
K. S&P 500 CY25 bottom-up EPS: December 31 – June 30
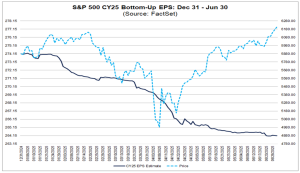
Source: FactSet
In addition to more positive earnings expectations, international markets have a valuation advantage and still trade at a big discount relative to the US.
L. Relative forward P/E ratio of US and non-US stocks
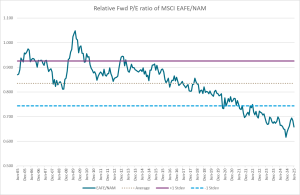
Source: KBIGI, LSEG, MSCI
Opportunities beckon beyond megacap tech
The US is not a homogeneous market. Indices and averages can hide opportunities.
In aggregate terms, US equities trade at ~22 times forward P/E, versus ~14 times in Europe. However, it’s important not to overgeneralise about regional valuations. It’s a concentrated problem with a specific segment of stocks, not the region as a whole.
Aside from megacap tech, many parts of the US market remain highly attractive. In fact, some segments of the US market – such as energy, financials, and industrials – are undervalued compared to other regional markets. These sectors are underrepresented in the leading US market indices but stand to benefit from secular shifts, such as deglobalisation, infrastructure renewal, and market rotation.
Tech is expensive, but many US stocks are cheap
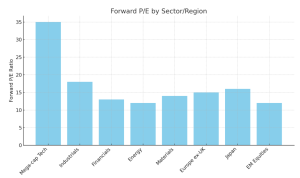
Source: KBIGI, Datastream, S&P 500
The overvaluation problem in the US is a concentrated one, not a widespread one.
Market concentration is increasing
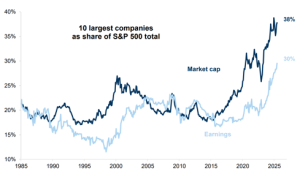
Source: FactSet, Goldman Sachs Global Investment Research
Where to turn next for upside potential
While US megacap technology stocks have delivered exceptional performance in recent years, we believe the case for continued relative outperformance is weakening. Structural, macroeconomic and valuation-related factors suggest that a market rotation – sectoral and size-wise within the US, and geographically across the globe – is increasingly likely.
We recommend reviewing current allocations to US megacap tech and evaluating opportunities in under-owned areas of the market with improving fundamentals and more favourable risk-reward profiles.
Leadership is broadening, and capital is flowing into historically overlooked areas. A proactive realignment today can help mitigate concentration risk and enhance forward-looking return potential. As global investors reconsider their concentration in US equities, Europe and Japan’s overlooked small caps may offer the highest upside potential.
Smaller firms, which tend to generate a higher share of their revenue domestically, may have an edge if there is further international trade disruption or increased fiscal spending. We explore this potential in our recent whitepaper.
Click here to read our recent whitepaper on Global ex US opportunities
All Markets
KBI Global Investors Ltd is regulated by the Central Bank of Ireland. KBI Global Investors (North America) Ltd is a registered investment adviser with the SEC and regulated by the Central Bank of Ireland. Registration does not imply a certain level of skill or training. KBI Global Investors (North America) Ltd is a wholly-owned subsidiary of KBI Global Investors Ltd. ‘KBI Global Investors’ or ‘KBIGI’ refer to KBI Global Investors Ltd and KBI Global Investors (North America) Ltd.
IMPORTANT RISK DISCLOSURE STATEMENT
Under MiFID II this is deemed marketing material and should not be regarded as investment research. This material is provided for informational purposes only and does not constitute an offer to sell or the solicitation of an offer to purchase any security, product or service including any group trust or fund managed by KBI Global Investors. The information contained herein does not set forth all of the risks associated with this strategy, and is qualified in its entirety by, and subject to, the information contained in other applicable disclosure documents relating to such a strategy. KBI Global Investors’ investment products, like all investments, involve the risk of loss and may not be suitable for all investors, especially those who are unable to sustain a loss of their investment.
RISKS:
By choosing an active investment manager, an investor places reliance on the firm and its strategies. Key person risk exists and a loss of one or more employees could result in poor performance and investors may lose money. There is no guarantee that a strategy will achieve its investment objective. The value of a portfolio can rise as well as fall. Diversification does not guarantee a profit or protect against a loss. Whilst it is the intention of the investment manager to implement strategies which are designed to minimise potential losses, there can be no assurance that a strategy will be successful. As a result, each investor should carefully consider whether it can afford to bear the risks of investing in a strategy prior to making an investment decision.
PAST PERFORMANCE IS NOT NECESSARILY INDICATIVE OF FUTURE RESULTS
This introductory material may not be reproduced or distributed, in whole or in part, without the express prior written consent of KBI Global Investors. The information contained in this introductory material has not been filed with, reviewed by or approved by any regulatory authority or self-regulatory authority and recipients are advised to consult with their own independent advisors, including tax advisors, regarding the products and services described therein. The views expressed are those of KBI Global Investors and should not be construed as investment advice. We do not represent that this information is accurate or complete and it should not be relied upon as such. Opinions expressed herein are subject to change without notice. The products mentioned in this Document may not be eligible for sale in some states or countries, nor suitable for all types of investors. Past performance may not be a reliable guide to future performance and the value of investments may fall as well as rise. Investments denominated in foreign currencies are subject to changes in exchange rates that may have an adverse effect on the value, price or income of the product. Income generated from an investment may fluctuate in accordance with market conditions and taxation arrangements. In some tables and charts, due to rounding, the sum of the individual components may not appear to be equal to the stated total(s). Additional information will be provided upon request. Performance for periods of more than 1 year is annualized. Gross results shown do not show the deduction of investment management fees. A client’s actual return will be reduced by the management fees and any other expenses which may be incurred in the management of an investment account. For example, a €1,000,000 investment with an assumed annual return of 5% with a management fee of 0.85% would accumulate €8,925 in fees during the first year, €48,444 in fees over five years and €107,690 in fees over ten years.
GIPS Performance Disclaimer
Our firm claims GIPS compliance and is annually verified by an independent verification firm to be so. The verification report from our verifier and our GIPS composite presentation are available upon request. The performance record disclosed here is that of the firm’s composite for this strategy.
USA/CANADA SPECIFIC: Indices
Information about indices is provided to allow for comparison of the performance of the Adviser to that of certain well-known and widely recognized indices. There is no representation that such index is an appropriate benchmark for such comparison. You cannot invest directly in an index, which also does not take into account trading commissions and costs. The volatility of the indices may be materially different from that of the strategy. In addition, the strategy’s holdings may differ substantially from the securities that comprise the indices shown. All MSCI data is provided “as is”. In no event shall MSCI, its affiliates, or any MSCI data provider have any liability of any kind in connection with the MSCI data. No further distribution or dissemination of the MSCI data is permitted without MSCI’s prior express written consent. Net total return indices reinvest dividends after the deduction of withholding taxes, using (for international indices) a tax rate applicable to non-resident institutional investors who do not benefit from double taxation treaties
MSCI World: The MSCI World index covers more than 1,600 securities across large and mid-cap size segments and across style and sector segments in 23 developed markets. MSCI ACWI: The MSCI ACWI Index covers more than 2,400 securities across large and mid-cap size segments and across style and sector segments in 46 developed and emerging markets. MSCI EM: The MSCI Emerging Markets Index covers more than 800 securities across large and mid-cap segments and across style and sector segments in 23 emerging markets. MSCI EAFE: The MSCI EAFE Index covers more than 900 securities across large and mid-cap stocks and across style and sector segments in 21 developed markets. MSCI EMU: The MSCI EMU Index covers more than 200 securities across large and mid-cap stocks and across style and sector segments in the 10 developed market countries in the EMU. MSCI North America: The MSCI North America Index covers more than 700 securities across large and mid-cap stocks and across style and sector segments in the USA and Canada markets. MSCI Europe: The MSCI Europe Index covers more than 400 securities across large and mid-cap stocks and across style and sector segments in 15 developed markets in Europe. MSCI World Small Cap: The MSCI World Small Cap Index covers more than 4,000 securities across small-cap stocks and across style and sector segments in 23 developed markets. MSCI World Value: The MSCI World Value Index covers more than 800 securities across large and mid-cap stocks exhibiting overall value style characteristics in 23 developed markets. MSCI EAFE Value: The MSCI EAFE Value Index covers more than 500 securities across large and mid-cap stocks exhibiting overall value style characteristics in 21 developed markets around the world, excluding the US and Canada. MSCI ACWI Value: The MSCI ACWI Value Index covers more than 1,300 securities across large and mid-cap stocks exhibiting overall value style characteristics in 46 developed and emerging markets. MSCI EM Value: The MSCI Emerging Markets Value Index covers more than 500 securities across large and mid-cap stocks exhibiting overall value style characteristics in 23 emerging markets. Russell 1000: The Russell 1000 index represents the highest-raking 1,000 stocks in the Russell 3000 index. Russell 2000: The Russell 2000 is a small-cap stock market index of the bottom 2,000 stocks in the Russell 3000 index. MSCI EAFE Small Cap: The MSCI EAFE Small Cap Index covers more than 2,200 securities across small-cap stocks and across style and sector segments in 21 developed markets. S&P 500 Index: The S&P 500 Index is a market-cap weighted index including 500 of the leading large-cap US equities.MSCI EM Small Cap: The MSCI EM Small Cap Index covers more than 1,800 securities across small-cap stocks and across style and sector segments in 23 emerging markets. MSCI NA Small Cap: The MSCI NA Small Cap Index covers more than 2,000 securities across small-cap stocks and across style and sector segments in the USA and Canada. Dax Global Agribusiness: The Dax Global Agribusiness Index represents the performance of global companies generating more than 50% of overall turnover from the agricultural economy. S-Network Global Water Index: The S-Network Global Water Index covers 60 global companies that derive 30% or more of annual revenues from participation in the water sector. Wilderhill New Energy Global Innovation Index: The Wilderhill New Energy Global Innovation Index is a global index of 98 companies listed on 29 exchanges in 23 countries whose technologies and services focus on the generation and use of cleaner energy, conservation, efficiency and the advancement of renewable energy in general. S&P Global Natural Resources Index: The index measures the performance of 90 of the largest companies in the natural resources and commodities businesses. This index is a composite of the three sub-indices listed below. The index is FMC weighted, subject to the single stock and country/market weight caps as detailed in Eligibility Criteria and Index Construction.
• S&P Global Natural Resources – Agriculture Index. The index measures the performance of 30 of the largest companies involved in agriculture and timber & forestry businesses around the world.
• S&P Global Natural Resources – Energy Index. The index measures the performance of 30 of the largest energy companies involved in oil, gas and coal exploration, extraction and production around the world.
• S&P Global Natural Resources – Metals and Mining Index. The index measures the performance of 30 of the largest mining companies involved in industrial and precious metals exploration, extraction and production around the world.
Lipper Global Natural Resources Index: The Lipper Global Natural Resources Index is an index of 30 natural resource funds. S&P Global Infrastructure Index: The S&P Global Infrastructure Index is designed to track 75 companies from around the world chosen to represent the listed infrastructure industry while maintaining liquidity and tradability – the index includes three distinct infrastructure clusters: energy, transportation and utilities.
This information contains forecasts, which are estimates only and not a reliable indicator of future performance.
Gross results shown do not show the deduction of Adviser’s fees. A client’s actual return will be reduced by the advisory fees and any other expenses which may be incurred in the management of an investment advisory account. See Part 2 of Adviser’s Form ADV for a complete description of the investment advisory fees customarily charged by Adviser. For example, a $1,000,000 investment with an assumed annual return of 5% with an advisory fee of 0.85% would accumulate $8,925 in fees during the first year, $48,444 in fees over five years and $107,690 in fees over ten years. Performance returns for individual investors may differ due to the timing of investments, subsequent subscriptions/redemptions, share classes, fees and expenses. Stocks mentioned in this document may or may not be held in this strategy at this time. Any projections, market outlooks or estimates in this document are forward-looking statements and are based upon certain assumptions. Other events which were not taken into account may occur and may significantly affect the returns or performance of the strategy. Any projections, outlooks or assumptions should not be construed to be indicative of the actual events which will occur. Discussions of market conditions, market high/lows, objectives, strategies, styles, positions, and similar information set forth herein is specifically subject to change if market conditions change, or if KBIGI believes, in its discretion, that investors returns can better be achieved by such changes and/or modification. Style descriptions, market movements over time and similar items are meant to be illustrative, and may not represent all market information over the period discussed. Form ADV Part 1 and Part 2 are available on request.
Stocks mentioned in this document may or may not be held in this strategy at this time.The securities listed are selected based on objective, consistently applied, non-performance-based criteria. Size or profitability of stocks mentioned have not been used in determining the selection of stocks and their inclusion should not be construed as a stock recommendation. A complete list of all securities recommended for the immediately preceding year is available upon request.
Any projections, market outlooks or estimates in this document are forward-looking statements and are based upon certain assumptions. Other events which were not taken into account may occur and may significantly affect the returns or performance of the strategy. Any projections, outlooks or assumptions should not be construed to be indicative of the actual events which will occur. Discussions of market conditions, market high/lows, objectives, strategies, styles, positions, and similar information set forth herein is specifically subject to change if market conditions change, or if KBIGI believes, in its discretion, that investors returns can better be achieved by such changes and/or modification. Style descriptions, market movements over time and similar items are meant to be illustrative, and may not represent all market information over the period discussed. Form ADV Part 1 and Part 2 are available on request.
Australia Specific:
KBI Global Investors (North America) Ltd is exempt from the requirement to hold an Australian Financial Services licence in respect of the financial services it provides to wholesale investors in Australia and is regulated by both the Central Bank of Ireland and the Securities and Exchange Commission of the US under US laws which differ from Australian laws. Any services provided in Australia by KBI Global Investors Ltd or other affiliates will be provided by the relevant entity as representative of KBI Global Investors (North America) Ltd. Ambassador Funds Management Services Pty Ltd (ASFL: 33 17 17) is licensed to provide general product advise in Australia and New Zealand to wholesale clients.
This material and any offer of investments is intended for and can only be provided and made to persons who are regarded as wholesale clients for the purposes of the Corporations Act of Australia and must not be made available or passed on to persons who are regarded as retail investors. It may not be reproduced or distributed, in whole or in part, without the express prior written consent of KBI Global Investors (North America) Ltd. The information contained in this introductory material has not been filed with, reviewed by or approved by any Australian or United States regulatory authority or self-regulatory authority and recipients are advised to consult with their own independent advisors, including tax advisors, regarding the products and services described therein.
Issued by Ambassador Funds Management Services Pty Ltd ABN 91 133 740 057.
Contact Information: Ambassador Funds Management Services, Level 12, 3 Spring St, Sydney NSW 2000, Australia. Ph: 61 2 9081 0230. Fax: 61 2 9081 0231, Level 16, 461 Bourke St, Melbourne VIC 3000, Australia, Ph: 61 3 8652 2848. Fax 61 3 8652 2849 www.ambassadorfms.com
Switzerland
KBI Fund ICAV is a collective investment scheme established under Irish Law. The Prospectus, the Key Investor Information Document (KIID), the Memorandum and Articles of Association together with the annual and semi-annual reports of KBI Institutional Fund ICAV can be obtained free of charge from the Swiss representative ACOLN Fund Services AG, Affolternstasse 56, CH-8050 Zurich. Paying agent in Switzerland is NPB New Private Bank Ltd, Limmatquai1, AMBellevue, Postfach, CH-8024 Zurich. The views expressed in this document are expressions of opinion only and should not be construed as investment advice.